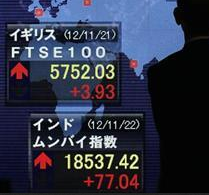
Know Your Index - The Origin of the FTSE 100
How the FTSE was formed and how the price is determined.
The FTSE 100 is an index comprised of the 100 largest companies on the London Stock Exchange (LSE). Traditionally viewed as a good indicator of the performance of the major companies listed in the UK, the FTSE 100 is the leading index for UK investors and citizens alike to keep an active eye on.
The Origin of the FTSE 100
Originating in 1984, the FTSE 100 is merely named after the company that calculates the index and the 100 companies the index contains. Owned by the London Stock Exchange and the Financial Times, the FTSE Group also maintains the FTSE 250, which is an index of the next 250 publicly traded UK companies with lower market capitalization.
Though it started with a value 1,000 in 1984, the value of the FTSE 100 has risen over the years to reflect the growing economic markets. The make-up of the index has also changed quite drastically over the years. A series of mergers and disappearing companies has led to only 3 of the original 100 companies currently maintaining a position on the powerful index.
What does the Index Value Mean?

|
|
FTSE 100 Leading Sectors and Businesses
The FTSE, and the British economy in general, is led by a multitude of top companies performing in a variety of sectors. However, index leaders, such as Royal Dutch Shell and British Petroleum, give significant insight into the sectors that are currently driving the UK market. Though construction firms and automobile manufacturers play a significant role, the oil, gas, and mining sectors are producing all-time high returns and continue to lead the way.
Unfortunately, one thing that is constant in business is change. As new companies continue to emerge and show significant growth, they have the opportunity to gain their spot on the FTSE 100 during each quarterly review. Savvy investors always have their eye on the FTSE and look for any opportunity to get their hands on a piece of the wealth.
Back To Day Trading Articles Menu
Day trading articles
- Articles menu
- Daytrading
- Pivot Points
- Dow Jones History
- Elliott Wave Basics
- Mind The "Gap"
- Commodity Trading
- Oil Futures Details
- Oil Economics
- Natural Gas
- Copper
- Cryptocurrency
- Valuation of Oil
- What is Spot Gold Price?
- Trading Gold Prices
- About Foreign Exchange
- About Money Transfers
- Origin of the FTSE 100
- AIM All Share Index
- Aluminum, Lead & Zinc
- Lithium and Mining
- Uranium, Rhodium,Cobalt
- Iron Ore, Nickel, Tin
- The Dow and Nasdaq Index
- About Hang Seng Index
- Chart Indicators
- Long Term Charts
LIVE INDEX CHARTS
- Dow jones chart
- S&P chart
- Nasdaq comp chart
- Nasdaq 100 chart
- Dax 40 chart
- Cac40 chart
- Swiss smi chart
- Nikkei chart
- Vix chart
- Hang seng chart
- Australia ASX chart
- Spain 35 chart
- Euro Stoxx 50 index
- Nifty 50 index
OIL AND METAL CHARTS
- Gold chart
- Silver chart
- Copper price chart
- Platinum price chart
- Palladium price chart
- Crude oil chart
- Brent oil chart
- Natural Gas chart
- Wheat Futures chart
FOREX CHARTS
- EUR/USD chart
- GBP/USD chart
- USD/JPY chart
- USD/CHF chart
- AUD/USD chart
- EUR/JPY chart
- GBP/JPY chart
- USD/CAD chart
- GBP/CHF chart
- EUR/GBP chart
- GBP/EURO chart
- EUR/CHF chart
- US Dollar Index
- Global currencies
CRYPTOCURRENCY
- Bitcoin Chart
- Bitcoin Euro Chart
- Bitcoin GBP Chart
- Ethereum Chart
- Ethereum Euro Chart
- Litecoin Chart
- Litecoin Euro Chart
- BNB Live Chart
- BNB GBP Price
- Shiba Inu Chart
INDUSTRIAL METALS
- Nickel price
- Iron Ore price
- Rhodium price
- Uranium price
- Aluminum price
- Lithium price
- Lead price
- Tin price
- Cobalt price
- Zinc price


