Elliott Wave
Basic Elliott Wave Theory and Tutorial
Elliott Wave was developed by R. N. Elliott (1938) as a way of analysing the equity markets, which tend to have a natural bullish cycle. This should be borne in mind when attempting to apply this principle to markets, which do not have the same cyclical tendencies, such as currencies and bonds. From the analytical perspective , the key is to determine the impulsive and corrective waves. Once the impulsive waves have been identified, the five wave sequence needs to be identified to provide a starting point from which to commence the analysis.
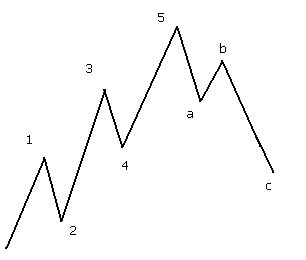
A typical wave pattern consists of five waves up in a bull markets, followed by three waves down.
The five waves up consists of three impulsive waves, 1, 3 and 5 and two corrective waves, 2 and 4. The correction following the completion of the five waves unfolds in three corrective waves, a, b and c. (See diagram below)
|
|

Each of the impulsive waves should break down into five waves of lower degree. One of the tenets of the Elliott Wave Principle is that two of the impulsive waves will tend to be of equal length, if not the relationship will tend to be 1:1.618 (key Fibonacci ratio). The corrective waves will often follow the Rule of Alternation in that if wave 2 is a simple one, wave 4 will tend to be complex, and vice versa.
The Elliott Wave relationship with Fibonacci ratios is quite strong, with corrective waves often retracing 38.2% or 61.8% of the impulsive waves. In addition, waves 2 and 4 are often related by these ratios.
Guidelines:
1) Wave 3 cannot be the shortest of the impulsive waves
2) 1 and 4 should not overlap (unless in a diagonal triangle)
3) Wave 2 and 4 should alternate (if one is complex, the other should be simple)
Corrective Waves (waves two and 4 and A-B-C) can take many forms but the most usual are:
1) 5-3-5 (Zig-Zag)
2) 3-3-5 (Flat)
3) 3-3-3-3-3 (Flat)
4) Double and triple threes (combined structures)
Day trading articles
- Articles menu
- Daytrading
- Pivot Points
- Dow Jones History
- Elliott Wave Basics
- Mind The "Gap"
- Commodity Trading
- Oil Futures Details
- Oil Economics
- Natural Gas
- Copper
- Cryptocurrency
- Valuation of Oil
- What is Spot Gold Price?
- Trading Gold Prices
- About Foreign Exchange
- About Money Transfers
- Origin of the FTSE 100
- AIM All Share Index
- Aluminum, Lead & Zinc
- Lithium and Mining
- Uranium, Rhodium,Cobalt
- Iron Ore, Nickel, Tin
- The Dow and Nasdaq Index
- About Hang Seng Index
- Chart Indicators
- Long Term Charts
LIVE INDEX CHARTS
- Dow jones chart
- S&P chart
- Nasdaq comp chart
- Nasdaq 100 chart
- Dax 40 chart
- Cac40 chart
- Swiss smi chart
- Nikkei chart
- Vix chart
- Hang seng chart
- Australia ASX chart
- Spain 35 chart
- Euro Stoxx 50 index
- Nifty 50 index
OIL AND METAL CHARTS
- Gold chart
- Silver chart
- Copper price chart
- Platinum price chart
- Palladium price chart
- Crude oil chart
- Brent oil chart
- Natural Gas chart
- Wheat Futures chart
FOREX CHARTS
- EUR/USD chart
- GBP/USD chart
- USD/JPY chart
- USD/CHF chart
- AUD/USD chart
- EUR/JPY chart
- GBP/JPY chart
- USD/CAD chart
- GBP/CHF chart
- EUR/GBP chart
- GBP/EURO chart
- EUR/CHF chart
- US Dollar Index
- Global currencies
CRYPTOCURRENCY
- Bitcoin Chart
- Bitcoin Euro Chart
- Bitcoin GBP Chart
- Ethereum Chart
- Ethereum Euro Chart
- Litecoin Chart
- Litecoin Euro Chart
- BNB Live Chart
- BNB GBP Price
- Shiba Inu Chart
INDUSTRIAL METALS
- Nickel price
- Iron Ore price
- Rhodium price
- Uranium price
- Aluminum price
- Lithium price
- Lead price
- Tin price
- Cobalt price
- Zinc price


