
Bollinger Bands
How to use bollingers and the history of the bollinger band
Bollinger Bands are a technical indicator for stock charts created by John Bollinger in the early 1980s. Bollinger Bands can also be refered to as trading bands. The purpose of the Bollinger is to provide a projected high and low price by the placement of bands on the stock chart.
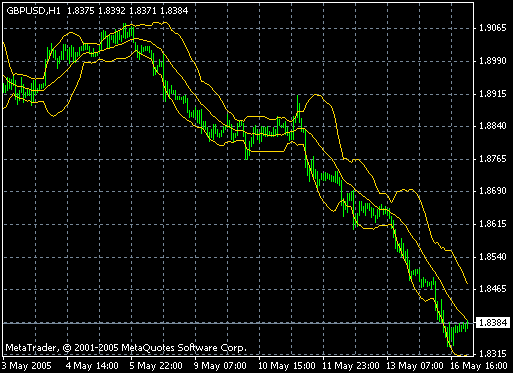
The Bollinger Bands appear on the chart as 3 bands. The Middle band being a simple moving average usually plotted in a 20 period. The upper and lower bands are calculated around a simple moving average plus or minus a standard deviation.
A Bollinger band is said to "Squeeze" when a large move is ready to happen. A squeeze is formed by the tightening of the Bollingers to form a tight channel around the price plot on the stock chart
Continue to read
|
|
In conjunction with other indicators that show "extremes" Bollingers can show reversal points in the trend when a price spikes out of the Bollingers range.
They can also be a good confirmation indicator of a trend, when the price is above the 20 period moving average in the middle of the Bollinger Bands and is pushing up the higher band then the trend will most likely be heading up, vice versa for down.
Bollinger Band example chart
Day trading articles
- Articles menu
- Daytrading
- Pivot Points
- Dow Jones History
- Elliott Wave Basics
- Mind The "Gap"
- Commodity Trading
- Oil Futures Details
- Oil Economics
- Natural Gas
- Copper
- Cryptocurrency
- Valuation of Oil
- What is Spot Gold Price?
- Trading Gold Prices
- About Foreign Exchange
- About Money Transfers
- Origin of the FTSE 100
- AIM All Share Index
- Aluminum, Lead & Zinc
- Lithium and Mining
- Uranium, Rhodium,Cobalt
- Iron Ore, Nickel, Tin
- The Dow and Nasdaq Index
- About Hang Seng Index
- Chart Indicators
- Long Term Charts
LIVE INDEX CHARTS
- Dow jones chart
- S&P chart
- Nasdaq comp chart
- Nasdaq 100 chart
- Dax 40 chart
- Cac40 chart
- Swiss smi chart
- Nikkei chart
- Vix chart
- Hang seng chart
- Australia ASX chart
- Spain 35 chart
- Euro Stoxx 50 index
- Nifty 50 index
OIL AND METAL CHARTS
- Gold chart
- Silver chart
- Copper price chart
- Platinum price chart
- Palladium price chart
- Crude oil chart
- Brent oil chart
- Natural Gas chart
- Wheat Futures chart
FOREX CHARTS
- EUR/USD chart
- GBP/USD chart
- USD/JPY chart
- USD/CHF chart
- AUD/USD chart
- EUR/JPY chart
- GBP/JPY chart
- USD/CAD chart
- GBP/CHF chart
- EUR/GBP chart
- GBP/EURO chart
- EUR/CHF chart
- US Dollar Index
- Global currencies
CRYPTOCURRENCY
- Bitcoin Chart
- Bitcoin Euro Chart
- Bitcoin GBP Chart
- Ethereum Chart
- Ethereum Euro Chart
- Litecoin Chart
- Litecoin Euro Chart
- BNB Live Chart
- BNB GBP Price
- Shiba Inu Chart
INDUSTRIAL METALS
- Nickel price
- Iron Ore price
- Rhodium price
- Uranium price
- Aluminum price
- Lithium price
- Lead price
- Tin price
- Cobalt price
- Zinc price
BREADTH CHARTS
LIVE STOCK CHARTS
