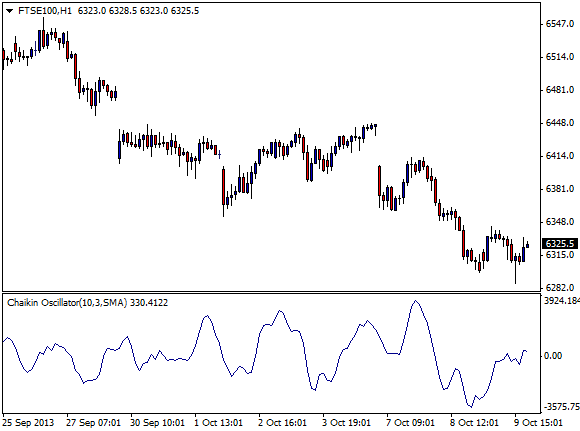
The Chaikin Oscillator Indicator And It's Use On Charts
| Please Google+ Like or Tweet Us! | Tweet |
The Chaikin Oscillator, developed by Mark Chaikin, is used by stock investors and analysts to calculate readings of an Accumulation/Distribution Line. In essence, the Chaikin Oscillator helps one recognize if a stock is either accumulating or undergoing distribution. The Chaikin Oscillator is calculated with the help of the Accumulation Distribution Line. The Accumulation Distribution Line an indicator that indicates price changes with volume. For instance, it takes into consideration the closing price in relation to the range of prices (H-L). As a stock closes closer to the high, the more
volume is added to the cumulative total.
How Do Traders Use This Indicator?
The Chaikin Oscillator is not considered to be a momentum oscillator. CMF focuses on where a stock closes in relation to the range for the period usually measured in time increments of daily or weekly. When using the Chaikin Oscillator there is usually buying pressure when a stock finishes in the top half of a period's range. Conversely, there is selling pressure, when a stock finishes in the bottom half of a period's range.

For those investors and analysts that would like to use the Chaikin Oscillator, there are some factors to consider. First off, the Chaikin Oscillator should be used with other types of technical analysis on your chart. Since the Chaikin Oscillator is different from a momentum oscillator, the price change from day to day has no bearing on its indices. However, the Chaikin Oscillator focuses on where a stock closes in relation to the period's range (daily or weekly). While this is an advantage of CMF, for some situations it can also be a disadvantage.
In addition, it is beneficial to use the Chaikin Oscillator with daily data instead of data that consists of intraday or weekly data. A full day's data has all the necessary properties including an open, high, low and close.
If you are using CMF, it is advisable that your time frame is 21 days instead of weekly. 21 days is usually one full month of trading, this allows the investor or analyst to get a good reading; in a shorter period of time your results may be choppier.
The Chaikin Money Flow Oscillator is a great way to identify positions that are overbought or oversold, while it can be complicated tool to use, it is an excellent indicator to be aware of.
Want To Test These Indicators On A Real Trading Platform WIth Zero Pips?
Open a free account and Download MT4 Platform. With this you can trade direct from charts and test all the built in indicators. It really is one of the best charting packages available.
More Chart Indicator Guides
The MACD Indicator - Moving Avergage Convergence Divergence
Moving Avergages and Parabolic SAR
RSI Indicator - Relative Strength Index
Bollinger Bands Indicator
Fast and Slow Stochastic Indicators
The Momentum Indicator Explained
The Money Flow Index Indicator
The Average Directional Movement Index (ADX)
If you like these guides, please show us you care and share them on Facebook, Google and Twitter with the buttons found above each article. We really appreciate it!

