Using The MACD Indicator To Determine Trend
| Please Google+ Like or Tweet Us! | Tweet |
The Moving Average Convergence/Divergence (MACD), is used to indicated swings in the price of various stocks in the future. This method is computed by taking two moving averages of one's price in the past, and is charted over a long period of time most often on a chart. The signal line compares the MACD's own average. Both of these lines created a chart that many traders believe can predict when a stock will rise or fall. Because MACD is determined by charting averages, the wide swings of a market can be displayed effectively. Analysts also use support lines, trend lines and divergence in their charting methods for MACD.
The Basic Concept
Within the concept of MACD occurs the MACD-Histogram. This ultimately showcases the difference between the two lines (MACD and signal line). This difference is easily identifiable on the chart. Sharp increases on the chart will indicated that the MACD is rising at a fast rate. While, sharp decreases in the price will show it's moving past the average and downward and could lead to trouble.
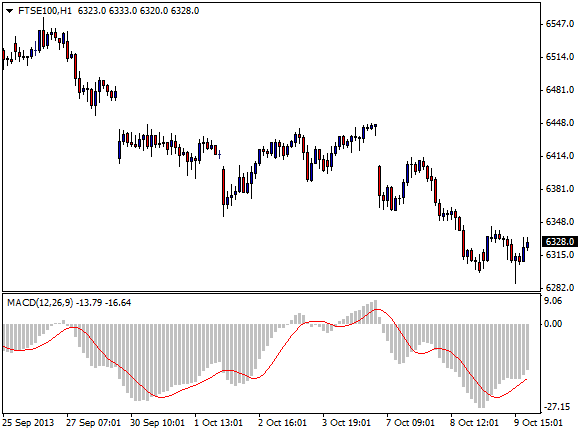
The main tools used in MACD and the Histogram include the crossovers that are charted. If a positive crossover is shown, then it shows the security as strong and could be picking up momentum in the market. While a negative one, many indicated a weakening security, and a time to sell for traders. As you can see on the FTSE 100 chart below, these chart indicators are very helpful in predicting the future of a stock or security.

By taking the time to chart things of this nature, many investors can accurately predict the future of one's stocks and help them stay on the right track to continuously making money. This trend following method could be a money saver for many individuals. Most importantly, charting something on a weekly basis allows the overall to be seen. Daily chartings can be negative because of their changes in various events such as holidays or political occurrences. Looking at the overall is the answer.
Want To Test These Indicators On A Real Trading Platform WIth Zero Pips?
Open a free account and Download MT4 Platform. With this you can trade direct from charts and test all the built in indicators. It really is one of the best charting packages available.
More Chart Indicator Guides
Moving Avergages and Parabolic SAR
RSI Indicator - Relative Strength Index
Bollinger Bands Indicator
Fast and Slow Stochastic Indicators
The Momentum Indicator Explained
The Money Flow Index Indicator
Chaikin Indicator
The Average Directional Movement Index (ADX)
If you like these guides, please show us you care and share them on Facebook, Google and Twitter with the buttons found above each article. We really appreciate it!

