RSI - Relative Strength Index
| Please Google+ Like or Tweet Us! | Tweet |
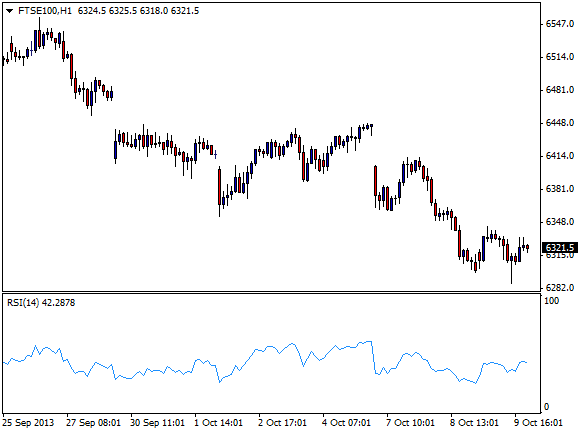
The Relative Strength Index, better known as RSI, is ultimately an analysis method that indicates overbought and oversold market conditions. Because it is relatively easy to interpret, this method is popular with investors.
When It Was Created
Created by J. Welles Wilder in 1978, this technical analysis tool used by market analysts will help predict the overall price for a stock in the near future. The term relative strength recognizes the overall market, which in turn, helps it to be a positive indicator of future market prices. Comparing the rise of the market with the rise of an individual security's strength creates this index.

While it measures the relation to itself (a single security), the chart indicator also shows a fluctuations from a scale that measures zero to 100. Most often, investors use these signals to buy when near 30 and sell at about 70. Other analysis methods include, knowing that a security is oversold if the line breaks near the buy mark (30). Also, if the line shows a break at 70, then the security was overbought and should move downward soon. This allows investors to predict the overall outcome of buying or selling a specific security.
This price-following analysis method creates trends for buying and selling various securities. These indication can ultimately make or break an investor's work with their clients. With failure swing, when a security changes out of nowhere, the analysis tools within the industry are no use to anyone and ultimately, ruin the trends that were established as a result of studying them. In turn, every method may help in some way in the future, but anything outrageous that occurs within the market can never be avoid, and/or predicted.
Want To Test These Indicators On A Real Trading Platform WIth Zero Pips?
Open a free account and Download MT4 Platform. With this you can trade direct from charts and test all the built in indicators. It really is one of the best charting packages available.
More Chart Indicator Guides
The MACD Indicator - Moving Avergage Convergence Divergence
Moving Avergages and Parabolic SAR
Bollinger Bands Indicator
Fast and Slow Stochastic Indicators
The Momentum Indicator Explained
The Money Flow Index Indicator
Chaikin Indicator
The Average Directional Movement Index (ADX)
If you like these guides, please show us you care and share them on Facebook, Google and Twitter with the buttons found above each article. We really appreciate it!

