Money Flow Index
| Please Google+ Like or Tweet Us! | Tweet |
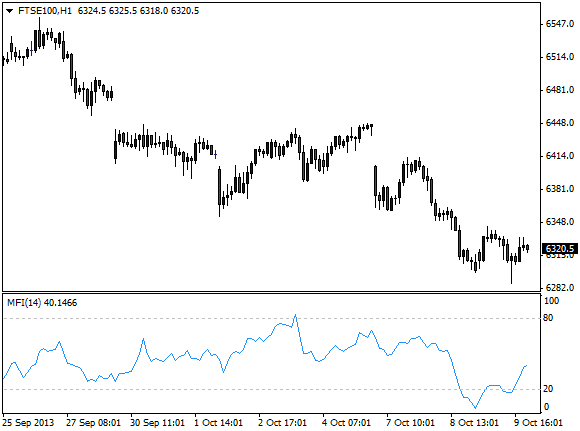
The Money Flow Index (MFI) is a momentum indicator for the strength of money flow for a specific security. Most often, investors relate it to the Relative Strength Index (RSI). However, the RSI incorporates mostly price, while the Money Flow Index uses volume as its major component. Most people interpret the index as above 80 then market tops will most likely occur. When the Index is less than 20, then the market will ultimately bottom out.
The index is calculated over a specific time period. This can be anywhere from 0 to 100 days, the time period calculate the money flow of the total days of “up” and “down” days for the market. Most often the equation of high+low+close divided by three equals the typical price. Most people interpret money flow as the product of the typical price and the volume on a given day.

Most people conclude that positive money flow is defined by the total for the specific number of days calculated where this “typical price” is higher than the day before. Negative money flow is the same except the price is lower than the previous day. Ultimately, the MFI is an oscillator or somewhat of a swinging pendulum. The important thing to remember with MFI is its relation to volume. Investors interpret the up days as satisfied buyers and down days for happy sellers. Ultimately, the fluctuation of either or will contribute to the reversal of the price in the overall. This allows the Index to be influential in investing decisions.
Want To Test These Indicators On A Real Trading Platform WIth Zero Pips?
Open a free account and Download MT4 Platform. With this you can trade direct from charts and test all the built in indicators. It really is one of the best charting packages available.
More Chart Indicator Guides
The MACD Indicator - Moving Avergage Convergence Divergence
Moving Avergages and Parabolic SAR
RSI Indicator - Relative Strength Index
Bollinger Bands Indicator
Fast and Slow Stochastic Indicators
The Momentum Indicator Explained
Chaikin Indicator
The Average Directional Movement Index (ADX)
If you like these guides, please show us you care and share them on Facebook, Google and Twitter with the buttons found above each article. We really appreciate it!

