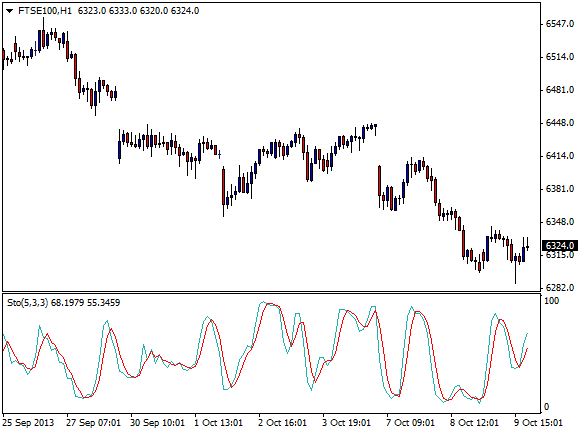
Fast Stochastic and Slow Stochastic Indicators
| Please Google+ Like or Tweet Us! | Tweet |
A stochastic is a tool used to help understand and identify turning points when other information is not available. For instance if a stock closed at a new high and you wanted to know if that stock will continue to climb or if you would like to know if the new stock high is only a false breakout, a stochastic can help. In addition stochastics are used by many investors and analysts to identify if stocks are overbought or oversold. There are two types of stochastics; fast stochastics and slow stochastics.
The stochastic oscillator uses a graph numbered from 0 to 100. The stochastic has two lines that oscillate on a vertical scale. The %K is considered to be the main line; it is represented as a solid line. The %D is considered to be the secondary line and it is represented as a dotted line on the graph.
The fast stochastic is defined as the average of the last 3 readings from %K. The slow stochastic is defined as the average of the last 3 days of the fast stochastic. In general, most analysts and investors rely on the slow stochastic due to the belief that the signals are much more reliable.

So What Do They Show Us?
Fast and Slow Stochastics are used to determine when to buy or sell stocks or securities. Usually when determining when to buy a stock an investor or analyst will wait for the fast stochastic to move above the slow stochastic on the graph. When the investor would like to sell a stock he or she waits for the slow stochastic to move below a fast stochastic.
There are many ways to use the fast stochastic oscillator effectively, they include, buying securities when either the %K or %D falls and then rises above 20. Conversely, many investors sell when the %K or %D rises above 80 and then abruptly falls below 80.
Another way to use the fast stochastic oscillator is to sell when the %K rises above the %D and sell when the converse is happening; %K falls below %D. In addition, investors and analysts should be on alert for divergences. Divergences can occur when prices continue to reach new highs while the stochastic oscillator continues to fall passing up its past highs
Want To Test These Indicators On A Real Trading Platform WIth Zero Pips?
Open a free account and Download MT4 Platform. With this you can trade direct from charts and test all the built in indicators. It really is one of the best charting packages available.
More Chart Indicator Guides
The MACD Indicator - Moving Avergage Convergence Divergence
Moving Avergages and Parabolic SAR
RSI Indicator - Relative Strength Index
Bollinger Bands Indicator
The Momentum Indicator Explained
The Money Flow Index Indicator
Chaikin Indicator
The Average Directional Movement Index (ADX)
If you like these guides, please show us you care and share them on Facebook, Google and Twitter with the buttons found above each article. We really appreciate it!

