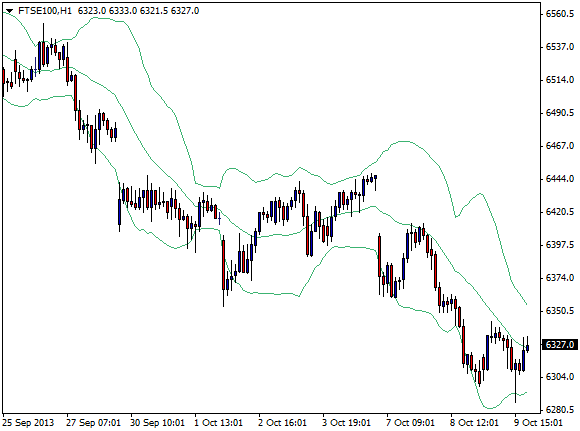
The Bollinger Bands Indicator
| Please Google+ Like or Tweet Us! | Tweet |
Bollinger Bands, a technical analysis tool that evolved from the term trading bands was invented by John Bollinger in the 80s. These bands are used to measure the shift of prices (volatility) due to previous trade highs and lows.
Many compare Bollinger Bands to moving average envelopes. These bands are plotted with various standard deviations (as mentioned above) to find a moving average. Investors have concluded that securities are often overbought if prices touch the upper band. In comparison, they are considered oversold if their price crosses the lower band, if you load up a FTSE 100 or Dow Jones chart and add the Bollinger Bands, you will see how they react to the touches. These standard interpretation beliefs help ensure the effectives of Bollinger Bands. The two standard deviations measures ensure that at least 95% of prices fall between the upper and lower band.

Most often, the Bollinger Bands self adjust, meaning that they widen at various volatile markets and contract when the market is quiet. Ultimately, they do not showcase when to buy or sell themselves. Market analysts however have come up with conclusions of how to determine those things with the information that the bands present. Most analysts use these bands with other indicators such as the RSI or the MACD. The combination of the two leads to the understanding of various trends within the market. This is why the bands are important to study and great indicators of buy/sell strategies.
These bands consist of 3 band the upper band, the middle band and the lower band. 2 parameters are used in determining the position of the bands. First the period usually 20 and the standard deviation usually 2. The middle band is represented by a moving average. For instance the 20 day moving average. The upper and lower bands are plotted around this moving average. The standard deviation of 2 would place the upper and lower bands such that there is a 95% confidence band.
Bollinger Bands - How to Calculate Them
- Calculate the moving average, for instance the 20 day moving average.
- Calculate the standard deviation of the close prices over the 20 day period
- The width of the band is given by StdDev * No of Devs. (In this case 2)
- Upper band = average(close, 20) + width (calculated in 3 above)
- Lower band = average(close, 20) - width (calculated in 3 above).
Trading the Bollinger Band - Usual Ways
- Buy when the price penetrates the upper band.
- Sell when the price penetrated the lower band.
- In All cases place your stop at the moving average level i.e. The middle band.
Want To Test These Indicators On A Real Trading Platform WIth Zero Pips?
Open a free account and Download MT4 Platform. With this you can trade direct from charts and test all the built in indicators. It really is one of the best charting packages available.
More Chart Indicator Guides
The MACD Indicator - Moving Avergage Convergence Divergence
Moving Avergages and Parabolic SAR
RSI Indicator - Relative Strength Index
Fast and Slow Stochastic Indicators
The Momentum Indicator Explained
The Money Flow Index Indicator
Chaikin Indicator
The Average Directional Movement Index (ADX)
If you like these guides, please show us you care and share them on Facebook, Google and Twitter with the buttons found above each article. We really appreciate it!

