What is the ADX Indicator and how is it used?
| Please Google+ Like or Tweet Us! | Tweet |
The average directional movement index (ADX) is a technical financial tool indicator. The creator of this technical indicator is Welles Wilder.
How Is It Used?
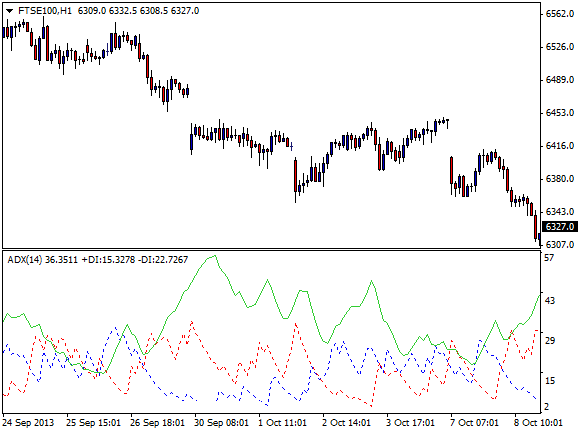
The average directional movement index is in a class of oscillators that are measured on a range from 0 to 100. However, it should be noted that while the graph measures from 0 to 100, most movements indicated on the chart very rarely rise above the range of 60.
For the most part, an indicating value below the value of 20 shows a trend that is weak. If a value is from 20 to 40, the trend is considered to be moderate. Trends above the value of 40 are considered to be strong. It should be noted that those values above 40 can show two types of trends, the first being a strong rising trend, the second being a strong descending trend.

ADX uses two indicators that were also created from Welles Wilder. The first indicator is called the Positive Directional Indicator and it is usually referred to as +DI, the second indicator is usually referred to as the Negative Directional Indicator or -DI. +DI shows strength and an upward movement; -DI shows weakness and a downward movement in a certain time range. As a whole, ADX unites both +DI and -DI to view trends, using both indicators assists in the smoothing of the data. Many investors will use ADX to catch a trend in its early stages. For instance, when a +DI crosses a -DI, the signals are usually interpreted as a buy signal, in converse, when a -DI crosses a +DI from the top, this usually signifies a sell signal.
The ADX indicator can be complicated to use and many casual investors might want to look at other types of analytical tools to understand or spot trends in the market. However for seasoned investors and analysis's the ADX index is an extremely proficient tool to spot trends at the very beginning of their creation and offers a wealth of information and insight to those that use it competently.
Want To Test These Indicators On A Real Trading Platform WIth Zero Pips?
Open a free account and Download MT4 Platform. With this you can trade direct from charts and test all the built in indicators. It really is one of the best charting packages available.
More Chart Indicator Guides
The MACD Indicator - Moving Avergage Convergence Divergence
Moving Avergages and Parabolic SAR
RSI Indicator - Relative Strength Index
Bollinger Bands Indicator
Fast and Slow Stochastic Indicators
The Momentum Indicator Explained
The Money Flow Index Indicator
Chaikin Indicator
If you like these guides, please show us you care and share them on Facebook, Google and Twitter with the buttons found above each article. We really appreciate it!

