
Using the trend signals
How to use our market trend signals
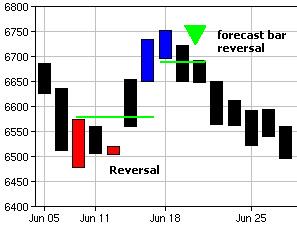
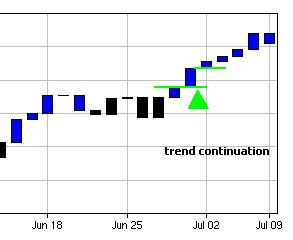
» Back to market trend Main MenuOur trend forecaster will generate up and down signals when buying or selling pressure builds up in a stock, currency, index or future. This forecast is not a recomendation to buy or sell. The forecasts are only a signal to watch for further strength above or below signal bars.
The forecasts can mean buying or selling pressure has built up so much a new high or low price will happen soon forming a continuation of the trend OR the price is overdone, and a close of a bar moving in the opposite direction to the last forecast bar could signal a trend failure or reversal point. See more examples..
|
|
For instance if there has been 2 up forecast bars in a row but the price is failing to break onto a new high, then also watch for a reversal in the price to break below the last "signal bar" low price. Vice versa for upward reversals.
In strong trends these forecasts are usually continuation signals, in ranging markets they are reversal points.

Index market trends
- Dow Jones market trend
- S&P 500 market trend
- Nasdaq Comp market trend
- Dax 30 market trend
- CAC 40 market trend
- Gold Price market trend
- Crude Oil market trend
UK market trends
- AAL - Anglo American
- AZN - Astrazeneca
- BLT - Billiton
- CBRY - Cadbury Schweppes
- CCL - Carnival
- RIO - Rio Tinto
- RBS - Royal Bank Of Scotland
- ULVR - Unilever
US market trends
- AMZN - Amazon
- BAC - Bank of America
- C - Citigroup
- EBAY - Ebay
- XOM - Exxon Mobil
- FDX - Fed Ex
- GOOG - Google
- MSFT - Microsoft
LIVE INDEX CHARTS
- Dow jones chart
- S&P chart
- Nasdaq comp chart
- Nasdaq 100 chart
- Nyse chart
- Dax chart
- Cac40 chart
- Swiss smi chart
- Nikkei chart
- Australia ASX chart
- Spain 35 chart
- Euro Stoxx 50 index
- Hang seng chart
- Nifty 50 index
- US Dollar Index chart
- Long term charts
LIVE STOCK CHARTS
CRYPTOCURRENCY
