

Long Term Indications
Today I want to look at some longer timeframe indicators that can help to confirm current sentiment and spot eventual potential changes. I am working from the premise that we are entering or are in a recessionary period globally. How long this period lasts for and how deep the recession goes are questions that are entirely subjective. Rather than try to answer them and cause a long debate with those that disagree, I prefer to look at indicators that confirm the downturn. Whilst in the short term this is not a huge step forward in knowledge, for the long term being able to monitor such indicators will help identify the next change in trend. Â
The Baltic Dry Index, managed by the Baltic Exchange in London, declined 421 points, or 5.7%, to 6,915 Wednesday 16th Jan. The index has declined 37% since hitting an all-time high of 11,039 last November.
The BDI measures the cost of shipping freight. A drop in demand for materials as production slows causes a surplus of freight moving ships, lowering the costs.
Currently the BDI is extremely correlated to the Shanghai Comp Stock Index. Conditions in China, where high inflation and tightening credit conditions continue to warn of an overheating economy, maybe approaching an inflection point. A large double digit percentage correction from current levels is close at hand.
Shanghai Comp v Baltic dry.
Hedge Funds have been the growth story in financials over the past 5 years. With the use of leverage and a more active trading approach their ability to move markets Hedge Funds are probably the main drivers of Index direction.
A recent report from Societe Generale Cross Asset Research showed Hedge Funds have been selling equities and favouring energy and commodities, being long gold and oil and rebuilding positions in softs. Of late Hedge Funds have been negative on small caps and Japanese equities but more neutral on US stocks. Hedge funds are long Yen and Euro and since the New Year, short on Sterling.Â
Whilst this information is difficult to find and therefore not practicable as an indicator, it does tell us that the focus on what the traditional brokerages and institutions are doing may be misplaced. It does show us that Hedge Funds may be a better indicator of trend, not because they are cleverer but because they are now the main drivers. The damage to brokerages, banks and institutions from the credit crunch may be so severe that they have lost primacy in stock markets.
Finally a look at a favourite chart of mine. The weekly Dow, logarithmic, with 2 trendlines, 120ma and the Coppock Indicator.Â
![]()
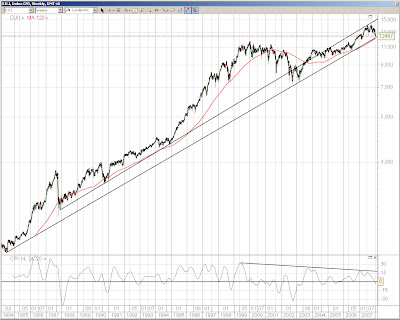
In keeping with my thoughts we see the CI is going down but as I mentioned in a previous article on my blog the CI is not a bear market indicator. However, it does a good job of showing when a trend is changing to an upward bias. An occasional check, say on a Monday morning before the markets open will help with the long term view. More interesting is the lower trend line from 1984 and the 120ma. A close below them (120ma at circa 12100) would be a warning of bear market conditions existing. Â
Sometimes a long term indicator can be beneficial in the short term.
Market Snippets
In keeping with the long term view:
WASHINGTON (Thomson Financial) – The US subprime mortgage crisis will likely produce deeper problems than it already has because not all market players have “come out clean” about their losses, the International Monetary Fund said Wednesday.
“Most banks in the United States have not yet marked their assets to genuine transaction prices,” Manmohan Singh and Mustafa Saiyid wrote in an IMF report.
Some market participants “have come out clean such as a few US hedge funds that have written off the value of all junior notes issued by its structured vehicles”, the report said.
However, even with conservative assumptions, the authors said that “potential losses may be higher and further capital injections are likely”.
Commentary by Mick Phoenix
on behalf of An occasional letter from The Collection Agency
Please Note: This article is to inform your thinking, not lead it. Only you can decide the best place for your money, and any decision you make will put your money at risk. Information or data included here may have already been overtaken by events – and must be verified elsewhere – should you choose to act on it. The views in the article are for informational purpose only.
 About Pete Southern
Pete Southern is an active trader, chartist and writer for market blogs. He is currently technical analysis contributor and admin at this here blog.
Most Popular Content
- Gold Flying and Making New All Time Highs
- Gold Prices Slip Ahead of Anticipated Economic Data
- Oil Prices Surge From Lows Amid Mixed Global Signals
- U.S. Stock Indices: A Dance Between Optimism and Fear
- Gold Prices Dance with CPI Data and the Fed
- Oil Prices Surge Amid Record Demand and Supply Tightening
- Gold Steady As US Dollar Index Tries to Make Gains
- Some Respite for Crude Oil within Bear Trend
Currency Articles - May 22, 2019 15:21 - 0 Comments
The Pound is in Freefall – When Will It Stop?
More In Currency Articles
- GBP Gets Ready for an Unpredictable Day with Meaningful Vote 2
- British Pound Stays Strong Whilst The Dollar Remains Weak
Gold and Oil News - Mar 30, 2024 10:37 - 0 Comments
Gold Flying and Making New All Time Highs
More In Gold and Oil News
- Gold Prices Slip Ahead of Anticipated Economic Data
- Oil Prices Surge From Lows Amid Mixed Global Signals